New figures show Covid-19 rates continuing to fall across Warwickshire - with encouraging statistics in the Leamington, Kenilworth and Warwick area
and live on Freeview channel 276
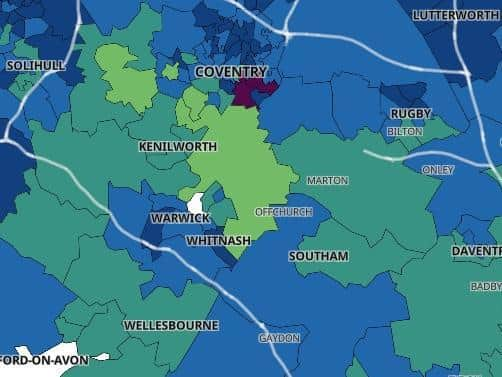
Covid-19 rates are continuing to fall across Warwickshire - with the Leamington, Kenilworth and Warwick are among the lowest.
This gives the community hope that the whole county will be moved out of the highest tier in two weeks, although the tier rankings are based on other measures such as rates among the over 60s and pressure on NHS services.
Advertisement
Hide AdAdvertisement
Hide AdAccording to the latest Government figures, Warwickshire has seen a 32.2% decrease in positive Covid-19 cases from the seven days to November 26, which covers the end of the latest lockdown.

The rolling rate is now 158.7 per 100,000 people, which is just above the national average.
The Warwick district has had a 42.5% decrease in cases and nealy all of the wards in the Warwick district have seen decreases - with many in and around Kenilworth seeing just single figure positives cases over the seven days.
In the Leamington West and Milverton ward, there were fewer than three cases.
Advertisement
Hide AdAdvertisement
Hide AdHere are the figures for the areas in Warwickshire plus Coventry and Solihull, in order of the highest positive cases per 100,000 people.
Figures from the seven days to November 26. Seven–day rolling rates are expressed per 100,000 population and are calculated by dividing the seven day count by the area population and multiplying by 100,000.
North Warwickshire
Total cases: 165
The rate has decreased relative to the previous week by 41 (-19.9%)
Rolling rate: 252.8 (above national average)
Nuneaton and Bedworth
Total cases: 302
The rate has decreased relative to the previous week by 145 (-32.4%)
Rolling rate: 232.5 (above national average)
Coventry
Total cases: 702
Advertisement
Hide AdAdvertisement
Hide AdThe rate has decreased relative to the previous week by 116 (-14.2%)
Rolling rate: 189.0 (above national average)
Solihull
Total cases: 385
The rate has decreased relative to the previous week by 203 (-34.5%)
Rolling rate: 177.9 (above national average)
Rugby borough
Total cases: 173
The rate has decreased relative to the previous week by 83 (-32.4%)
Rolling rate: 158.8 (above national average)
Warwick district
Total cases: 169
The rate has decreased relative to the previous week by 125 (-42.5%)
Rolling rate: 117.6 (below national average)
Stratford district
Total cases: 108
Advertisement
Hide AdAdvertisement
Hide AdThe rate has decreased relative to the previous week by 42 (-28.0%)
Rolling rate: 83.0 (below the national average)
Warwickshire
Total cases: 917
The rate has decreased relative to the previous week by 436 (-32.2%)
Rolling rate: 158.7 (just above the national average)