How Leamington, Warwick and Kenilworth compare to other areas of the country when it comes to Covid and vaccination rates
and live on Freeview channel 276
As the country eases its way out of lockdown, all eyes will be on the Covid-19 data as shops, gyms, barbers and beer gardens reopen.
The good news for the Warwick district is that our rates of Covid cases have consistently stayed low and continue to fall.
Advertisement
Hide AdAdvertisement
Hide AdAnd when it comes to vaccinations, it gets even better. In NHS data up to April 4, 99.4 per cent of people over 50 have had a least one dose of a vaccine, with the rate of people between 18-49 at 29.8 per cent. That is the seventh best rate in the country - the best rate is the neighbouring Stratford district, with 100 per cent of those over 50 have their first jab.
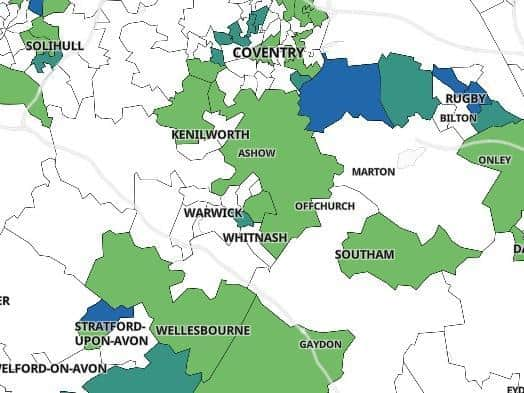

According to data covering the seven days up to April 8, the Warwick district has a rolling rate of 16.7 cases per 100,000 people, which is below the national average. It is also the best in Warwickshire (see county figures at the end of the article).
Many individual wards in Leamington, Warwick and Kenilworth have once again not recorded any new Covid cases and all the other areas are below the national average, bar one -
Leamington Brunswick. But even that rate (54.9) is only just above the national average and they have only recorded six new cases over the seven-day period.
Advertisement
Hide AdAdvertisement
Hide AdWhile this is encouraging, it is still a way off some areas in the south east and the south west of England, as well as Scotland and Wales, which have seen dramatic drops. However, it must be remembered that some of these areas are more sparsely populated than the Warwick district and that helps reduce and control the rates. In Dumfries and Galloway, the rate is just 1.3 cases per 100,000 people over the same seven-day period, while in Folkestone the rate is 1.8. The Derbyshire Dales has a rate of just 2.8 and North Norfolk 2.9.
Nearer the home in the West Midlands, Cannock Chase has a rate of 7.9 cases per 100,000 people, with just eight new cases over the seven days up to April 8. Shropshire's overall rate is 9.9, compared to Warwickshire's 31.0, which is above the national average.
Here are the rates for each district and borough in Coventry and Warwickshire, in order of the lowest rolling rate per 100,000 people over a seven-day period up to April 8.
Warwick
Total cases: 24
The rate has decreased relative to the previous week by 13 (-35.1%)
Rolling rate: 16.7
Nuneaton and Bedworth
Total cases: 32
Advertisement
Hide AdAdvertisement
Hide AdThe rate has decreased relative to the previous week by 31 (-49.2%)
Rolling rate: 24.6
Coventry
Total cases: 98
The rate has decreased relative to the previous week by 77 (-44.0%)
Rolling rate: 26.4
Stratford-on-Avon
Total cases: 38
The rate has decreased relative to the previous week by 3 (-7.3%)
Rolling rate: 29.2
North Warwickshire
Total cases: 28
The rate has decreased relative to the previous week by 42 (-60.0%)
Rolling rate: 42.9
Rugby
Total cases: 57
Advertisement
Hide AdAdvertisement
Hide AdThe rate has decreased relative to the previous week by 2 (-3.4%)
Rolling rate: 52.3
Warwickshire (overall)
Total cases: 179
The rate has decreased relative to the previous week by 91 (-33.7%)
Rolling rate: 31.0